deccatalkingpoints@decdesign.com
The Power of Infographics
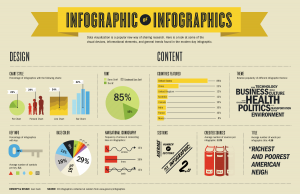
A useful component of modern marketing, visual marketing refers to image-based sharing of information, and is increasingly supported by innovative design software. Infographics are being used more and more in the content marketing mix.
Well-made infographics organize data into a coherent narrative that your target audience can more easily understand, and well-executed infographics are a more enjoyable learning tool than multiple paragraphs of copy.
Creating Visual Content
The most important thing to remember is that the design drives the effectiveness. When you create your infographic, it’s important to avoid some common mistakes.
From choosing the right colors to defining key points, your design needs to be appealing to your target audience with content that is relevant, useful, and logically presented.
Maximizing your Return
If the content of your infographic is unique and valuable to your audience, it can go viral, bringing additional traffic to your website. This is the crux of successful inbound marketing: delivering something of value in return for traffic and leads. In addition to direct email, websites and social media networks, here are some of the best ways to get the most exposure and return on your investment.
- Create a “home-base”
This is the URL where your infographic lives and where you will direct traffic and track for analytics. - Develop a thumbnail-ready image
Infographics are normally tall images. Sites like Facebook look for square shaped images to use within posts. Control how your infographic is displayed by creating a thumbnail-ready image for your social media posts. - Display an embed code
For greater control over how people share your infographic, and how links direct traffic to your website, create an embed code and display it below your infographic. This makes it easy for visitors to share your visual content. Hubspot shows how to simply create one: http://blog.hubspot.com/how-to-create-embed-codes-generator-infographic-content-ht - Submit to Online Directories
Posting your creation to online infographic directories is another way to increase traffic. But not all directories are appropriate or created equally. This article on directory links will help you focus your efforts: http://www.seerinteractive.com/blog/infographic-submission-sites-the-good-mediocre-ones-to-avoid - Track Response
Bitly – Creating a unique bitly link will enable you to share across social media networks and monitor your social stats. You can track how and where your infographic is being shared and adjust your marketing strategy accordingly.
QR Code – If you are printing the piece consider using a QR code to track response.
Google – You can set up aa QR code to track response.
Google alert for your infographic title: http://www.google.com/alerts and run image searches to see where it is popping up: http://www.google.com/imghp
Source: Evona Wiktoria